This blog post is devoted to our paper: “A three-stage model pipeline predicting regional avalanche danger in Switzerland (RAvaFcast v1.0.0): a decision-support tool for operational avalanche forecasting”, which has been submitted and is currently under review at Geoscientific Model Development. The preprint is available here.
Summary
RAvaFcast [1] is a data-driven model pipeline developed for automated regional avalanche danger forecasting in Switzerland. It combines a recently proposed classifier for avalanche danger prediction at weather stations [2] with a spatial interpolation model and a novel aggregation strategy to estimate the danger levels in predefined wider warning regions, ultimately assembled as an avalanche bulletin (see Figure 1a).
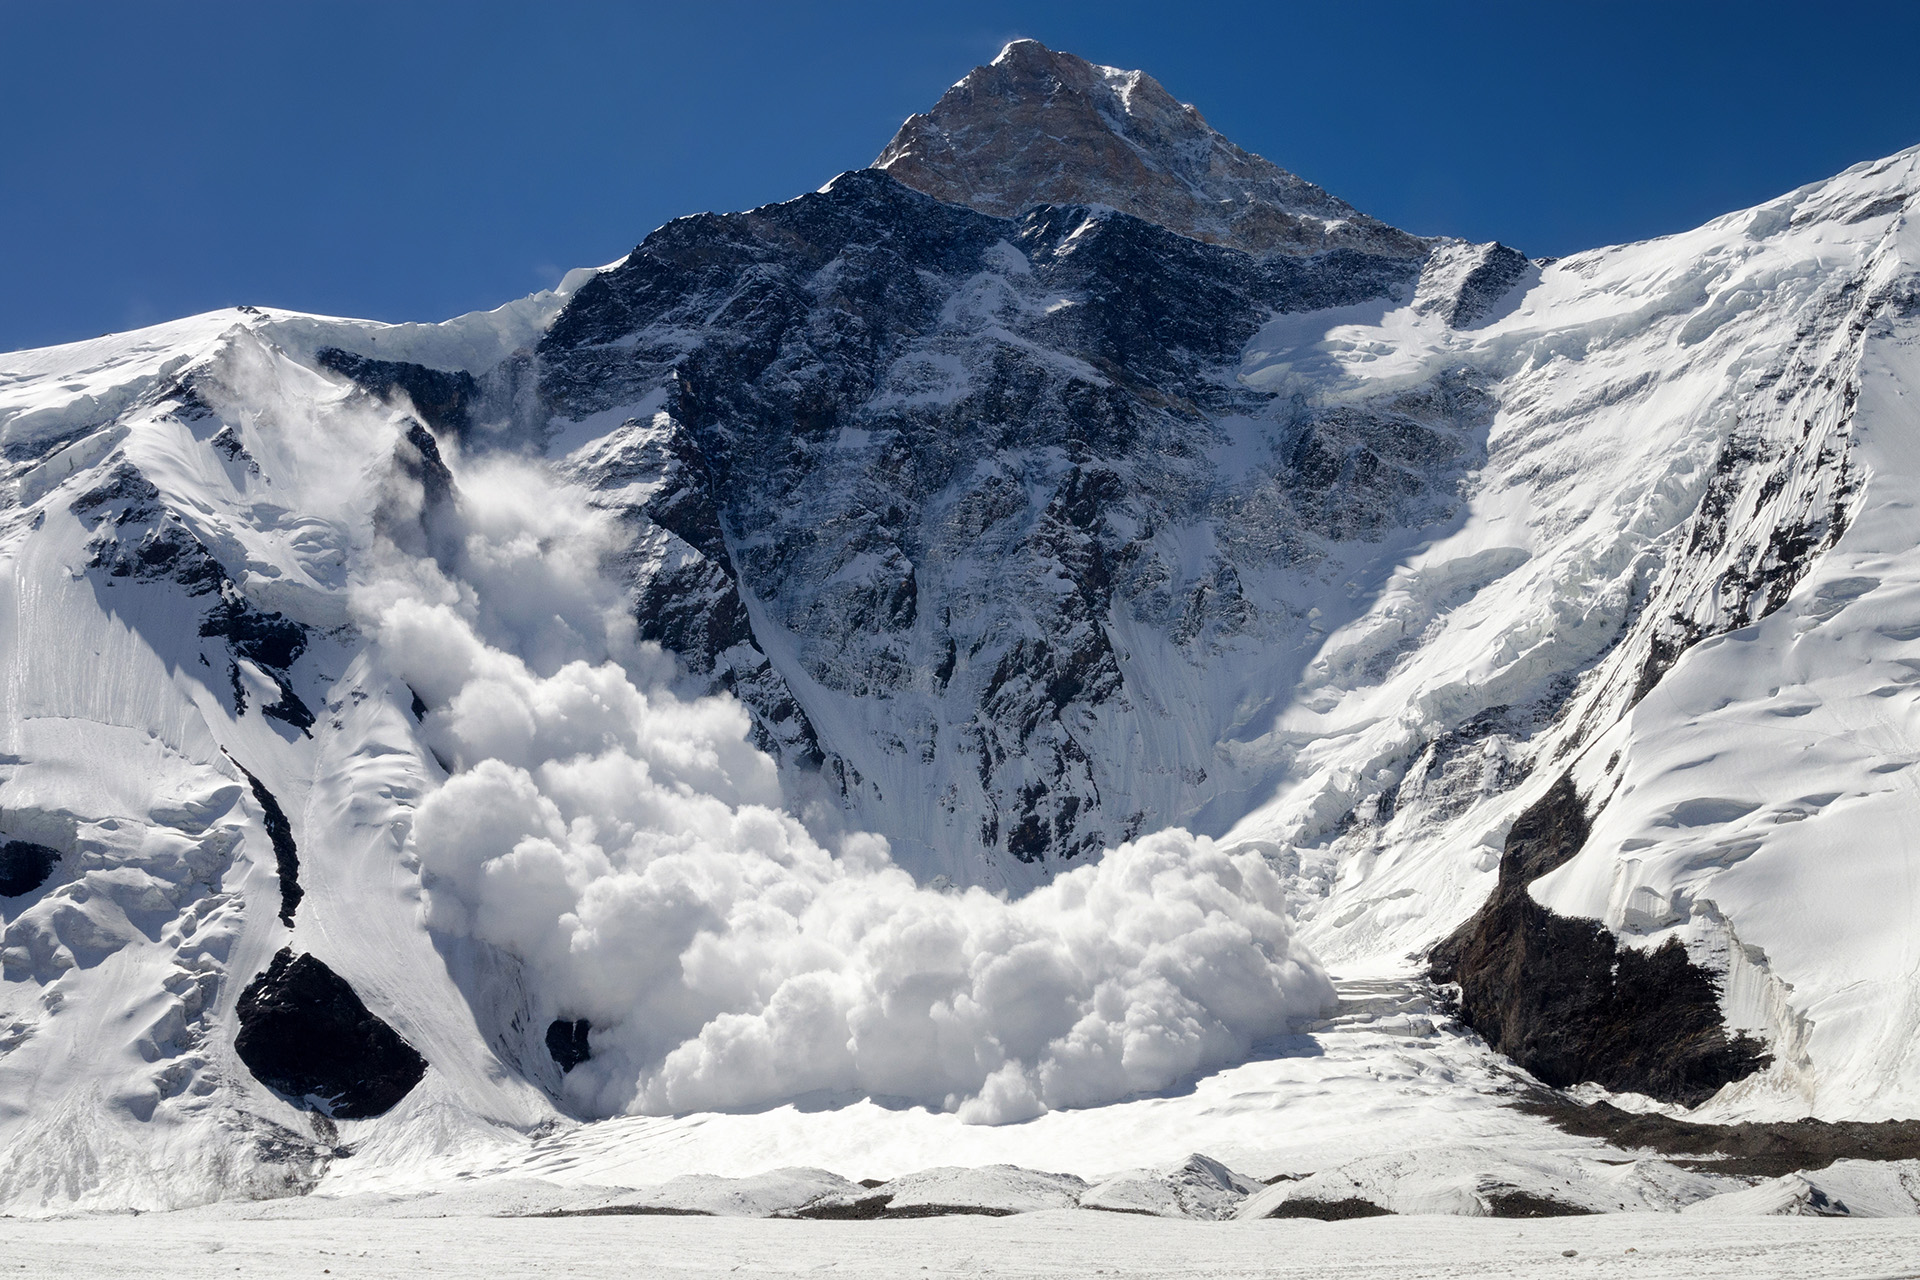
The deadly threat of avalanches
In Switzerland, snow avalanches pose a significant threat, causing the highest fatalities among natural hazards. The winter season of 2022/23 tragically saw 226 people caught by avalanches, resulting in 23 deaths - slightly exceeding the yearly average of 21. To address this danger, the WSL Institute for Snow and Avalanche Research SLF in Davos provides vital avalanche forecasts nationwide. Published twice daily (morning and evening) throughout the winter season (typically spanning from November to May) on their website, slf.ch, and the White Risk App, these forecasts inform the public and professional decision-makers about critical snow and avalanche conditions. The forecasts use the five-level European avalanche danger scale ranging from “generally favorable” (level 1-low) to “extraordinary” (5-very high (see Figure 1a)). They also specify slope aspects (N, W, S, E) and elevations where the indicated danger levels are most relevant. Specifically, for dry-snow avalanches, elevation thresholds highlight that the altitude above is particularly affected. Thresholds are denoted in 200-meter increments, typically between 1400 meters and 2600 meters above sea level. For example, the avalanche bulletin in Figure 1a indicates a danger level 4 for elevations at or above 2000m, with all slope aspects at risk (shown by black shading).

Figure 1: Avalanche forecast and monitoring network in Switzerland
a) Avalanche bulletin from (24 December 2019 08:00 local time): Illustrates regional forecast danger levels (colors), with critical slope aspects and elevations (insert). Black polygons outline warning regions, the spatial units for forecast products in Switzerland. Bold outlines group warning regions within the forecast.
b) Automated weather stations: Displays the distribution of weather stations used in this study. Warning regions are outlined in white for visual reference.
While physical snowpack modeling coupled with machine learning approaches have made significant strides, avalanche forecasting remains a complex process heavily reliant on expert analysis of diverse weather and snowpack data. To address this challenge, our paper, “A three-stage model pipeline predicting regional avalanche danger in Switzerland (RAvaFcast v1.0.0): a decision-support tool for operational avalanche forecasting,” introduces a fully automated, data-driven model pipeline. This pipeline is designed to generate forecasts similar to the official avalanche forecast in Switzerland, covering all relevant regions within the country.
RAvaFcast | Automatic prediction of regional avalanche forecasts
RAvaFcast, our proposed avalanche forecasting model, employs a three-stage pipeline (Figure 2) for regional avalanche danger prediction. This pipeline comprises Classification, Interpolation, and Aggregation steps to generate three distinct outputs:
- Station-specific danger levels: Precise predictions for locations with automatic weather stations.
- High-resolution danger maps: Detailed visualization of danger levels across Switzerland’s mountainous terrain.
- Regional avalanche bulletin: Aggregated danger levels presented in a format aligned with the official avalanche bulletin published by the SLF.

Figure 2: The RAvaFcast three-stage pipeline for avalanche danger prediction.
- Stage 1: Analyzes meteorological data and snowpack simulations to predict danger levels at automatic weather stations.
- Stage 2: Extends predictions across Switzerland using a spatial model, generating a high-resolution danger level map.
- Stage 3: Calculates danger levels for specific warning regions, providing forecasts aligned with official bulletins.
Classification (Stage 1) - From a sea of data to local danger level predictions
In the classification stage, we utilized the random forest (RF) classifier developed by Perez-Guillén et. al. [2] to predict avalanche danger levels at automatic weather stations. This classifier analyzes a wealth of meteorological data (e.g., fresh snow, wind speeds, temperature) from both current as well as previous days, along with simulations of the snow stratigraphy and snow stability provided by the physics-based snow-cover model SNOWPACK [3]. Crucially, it was trained on over 20 winter seasons of historical data, where avalanche bulletins were used to label conditions. The model predicts a probability distribution of danger levels, allowing us to determine the most likely danger level class and extract the expected danger level (a real number ranging from 1 to 4). Due to the rarity of danger level 5 conditions in the dataset, these cases were merged with danger level 4.
Interpolation (Stage 2) - High-resolution danger level maps
Although over 120 automatic weather stations (see Figure 1b) provide localized danger level predictions using the RF classifier, many areas lack these stations. To bridge the gap, the interpolation stage extends predictions to unobserved locations. This process considers both the spatial location and terrain features (e.g., slope angle) of these points.
We employed a Gaussian process (GP) regression model, which not only estimates danger levels but also provides a measure of uncertainty in the predictions. To account for the noise in the predictions from stage 1, we modeled the expected danger level \(d(\mathbf{x})\) using a GP with homoscedastic additive Gaussian noise. Here, \(\mathbf{x}\) represents the location, including terrain features. In particular,

Mathematically, a GP is defined by a mean function \(m(\mathbf{x})\) and a covariance (or kernel) function \(k(\mathbf{x}, \, \mathbf{x'})\). Our model uses a constant mean function and a composition of weighted independently parametrized radial basis function (RBF) kernels. The parameters of these kernels are automatically learned during model optimization, allowing them to adapt to daily variations in avalanche conditions. Applying the interpolation model on a 1km x 1km grid generates continuous danger level maps (Figure 2, middle), offering a high-resolution overview of avalanche danger across Switzerland.
Aggregation (Stage 3) - Assembling an avalanche bulletin
Our pipeline includes a final aggregation step to align with the format of traditional, human-made avalanche forecasts. This step summarizes predicted danger levels within predefined warning regions (see Figure 1a) at specific elevations (i.e., 1200, 1600, 2000, and 2400 meters above sea level) with a novel elevation-based aggregation strategy. It involves averaging all the predictions on the 1 km x 1 km grid within a vertical distance of 200 meters from the target elevation for each warning region. A refined thresholding approach then converts these averages into discrete danger levels. Finally, the maximum danger level across the four elevations dictates the overall assessment of the warning region. This method mirrors expert practice, highlighting the most critical elevations and providing a comprehensive picture of regional avalanche danger.
Results
To assess the effectiveness of our three-stage pipeline, we compared the daily agreement between the danger levels predicted by RAvaFcast and those published in the official avalanche bulletins. Figure 3 summarizes the key findings for different groups of warning regions alongside the standalone accuracy of the initial classification stage (using the RF classifier).

Key Observations
- Central Alps: The highest accuracy was achieved in the Alps with all scores exceeding the RF classifier's performance. This is unsurprising, as most available weather stations are located in this region, providing more data for the model to learn from.
- Lower performance in other regions: Performance was lower in areas surrounding the Alps, such as the Pre-Alps and Southern Alps, and particularly poor in the Jura region. This can be attributed to the limited number of weather stations in these areas, making it challenging for the data-driven model to extrapolate predictions accurately.
Consequently, given the variable nature of avalanche conditions across space and elevation, it is evident that both the quantity and distribution of weather stations, along with the accuracy of the initial classification model, are crucial determinants for the accuracy of regional danger level forecasts. This is perceptible in the video below, showing the evolution of RAvaFcast’s predictions for three winter seasons (2018/19 until 2020/21).
Video 1: The evolution of the three-stage pipeline's predictions (a)-(c) for winter season 2018/19 until winter season 2020/21 in comparison to the official avalanche bulletin (d).
Conclusion: Towards enhanced avalanche danger forecasting
This blog post introduced RAvaFcast, a data-driven pipeline utilizing diverse data sources (Figure 2) to automatically generate avalanche danger level forecasts with a spatial resolution mirroring the format used by the SLF. Besides that, RAvaFcast offers three additional valuable outputs:
- High-resolution danger maps (1 km) for comprehensive spatial visualization of avalanche danger.
- Uncertainty maps (1 km) indicating the level of confidence in the predictions.
- Elevation-specific danger levels similar to those provided in human-made forecasts.
While accuracy limitations exist in regions lacking weather stations, RAvaFcast demonstrates the potential of fully automated models to support human forecasters during their crucial decision-making processes. This technology holds promise for improving the efficiency and accuracy of avalanche forecasting in the future.
To learn more about RAvaFcast, access the preprint. Contact us for further information about the project.
The DEAPSnow project
This research was conducted in Alessandro Maissen’s Master’s thesis, contributing to the DEAPSnow project. DEAPSnow is a collaborative effort between the Swiss Data Science Center and the WSL Institute for Snow and Avalanche Research SLF, dedicated to developing machine learning models for operational avalanche forecasting.
Co-authors
- Frank Techel, WSL Institute for Snow and Avalanche Research SLF
- Michele Volpi, Swiss Data Science Center, EPFL and ETH Zurich
References
- Maissen, A., Techel, F., & Volpi, M. (2024). A three-stage model pipeline predicting regional avalanche danger in Switzerland (RAvaFcast v1.0.0): a decision-support tool for operational avalanche forecasting. EGUsphere, 2024(1), 1-34. https://doi.org/10.5194/egusphere-2023-2948
- Pérez-Guillén, C., Techel, F., Hendrick, M., Volpi, M., van Herwijnen, A., Olevski, T., Obozinski, G., Pérez-Cruz, F., & Schweizer, J. (2022). Data-driven automated predictions of the avalanche danger level for dry-snow conditions in Switzerland. Natural Hazards and Earth System Sciences, 22*(6), 2031-2056. https://doi.org/10.5194/nhess-22-2031-2022
- Lehning, M., Bartelt, P., Brown, B., Russi, T., Stöckli, U., & Zimmerli, M. (1999). SNOWPACK model calculations for avalanche warning based upon a new network of weather and snow stations. Cold Regions Science and Technology, 30(1), 145-157. https://doi.org/10.1016/S0165-232X(99)00022-1
About the author


