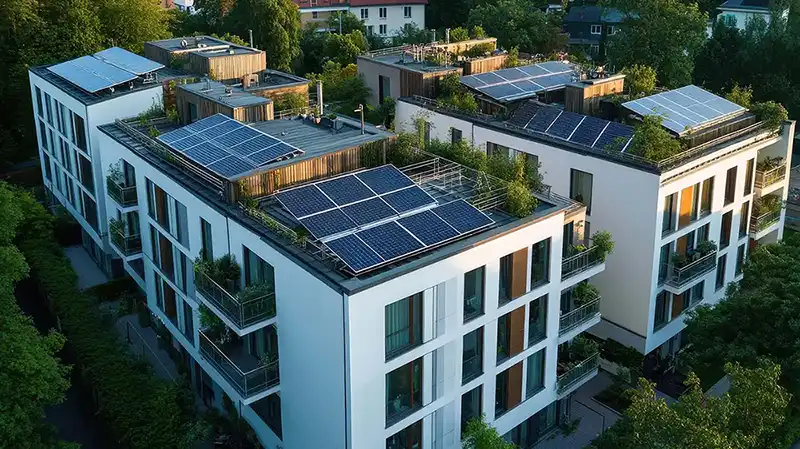
This blog post is dedicated to our paper with the same title. View the preprint (on arXiv and submitted for review).
Summary
Cities worldwide face a critical shortage of affordable and decent housing. Despite its crucial importance for policy, it is difficult to effectively monitor and track progress in urban housing. We attempt to overcome these limitations by utilizing self-supervised learning with over 15 million street-level images taken between 2008 and 2021 to measure change in London. Street2Vec, our novel adaptation of Barlow Twins, embeds urban structure while being invariant to seasonal and daily changes without manual annotations. Its capability of detecting varying degrees of point-level change can provide timely information for urban planning and policy decisions toward more liveable, equitable, and sustainable cities.
The housing crisis and image data
The global urban housing crisis has emerged as a pressing issue in recent decades, with cities worldwide facing a critical shortage of affordable and decent housing. For city governments to allocate resources to affordable housing initiatives and to regenerate and expand the housing supply, timely measurements at high spatial resolution are crucial for tracking progress and informing interventions, yet largely lacking.
The growing availability of affordable, large-scale image data, combined with methodological advances in computer vision, holds great potential for accelerating and improving large-scale measurements in urban areas. Street-level images attract particular attention as they capture urban environments as experienced by their residents and can provide very high spatial and temporal resolution. Despite mapping providers such as Google, Baidu, and Mapillary collecting and archiving multi-year street-level images of several cities for over a decade, many prior studies were cross-sectional. So far, researchers have found it difficult to obtain temporally coherent and spatially dense labeled data at scale, as required by supervised methods. Therefore, research has yet to fully explore the potential of the temporal dimension of street-level images for studying urban change.
Street2Vec: Self-supervised learning from street-level images
Our dataset consists of a large set of geolocated street-level images. The only information available for each image is the acquisition year and location. No additional annotations are provided. This problem setting is particularly well suited for a relatively recent paradigm in deep learning known as self-supervised representation learning (SSL in short). The goal of SSL is to learn vector representations (i.e., embeddings) of input data that condense relevant characteristic information without the need to train over target labels. We aim to learn representations of street-level images that can capture and discover structural changes in the city but are invariant to common and irrelevant variations such as lighting conditions, seasonality, and vehicles and people appearing in the images. To achieve this, we propose adapting the Barlow Twins method from [1] to temporal street-level images: Street2Vec.

In the original paper [1], the Barlow Twins method is applied to two different sets of content- preserving artificial distortions on images, such as cropping, color jittering, and horizontal flipping. The model is trained by forcing it to learn the same representations for these different sets of modified images. In our setting depicted in Figure 1, instead of applying a set of predefined artificial distortions to the images, we take two image panoramas from the same location but captured in different years as input. At each training step, we sample a new batch of street-level images from random locations and points in time. Then we sample the second batch of images (the “distorted” samples) from the same locations but taken in a different year. We then apply the Barlow Twins method to learn aligned image embeddings with uncorrelated feature dimensions. We name this approach Street2Vec, as we learn visual vector embeddings from street-level images.
We assume that, on average, street-level images taken at two different time instants will have strong visual appearance variations that represent changes that are semantically irrelevant for this study, such as different lighting conditions, seasonality, moving people and cars, but no or only minimal changes in urban structural elements. However, we cannot completely rule out any structural change between any two of those images. In fact, our primary interest is identifying locations where street-level images capture structural change. However, we expect that these cases occur much less frequently and do not influence the model's convergence. Therefore, we posit that our model implicitly learns representations invariant to irrelevant change but sensitive to urban structural elements without labels explicitly highlighting such changes. We define irrelevant change to include lighting conditions, seasonal change in vegetation or clouds, snow, slight differences in the view resulting from the relative position of the camera, and occlusion of built environment features by cars, vegetation, or individuals.

Once our model is fully trained, we can use it to map the urban change between two points in time, as illustrated in Figure 2. For this study, we have selected the years 2008 and 2018 as they are spaced the furthest apart among all years for which we have considerable overlap between image locations. Concretely, for 329,031 locations evenly spread across Greater London, we compute the cosine distances between the embeddings of the images from 2008 and the ones from 2018. This measure of structural change can either be investigated at the point level or aggregated within larger regions, such as London’s Middle Super Output Areas (MSOAs).
Subtle shifts vs. major new developments
Looking at all predicted changes between 2008 and 2018, we found that a majority of locations have evolved only minimally according to our model, as illustrated in Figure 3 with a logarithmic scale for the y-axis. In a developed city like London, this result is expected for the short period of a decade.

We investigated whether Street2Vec can identify relatively subtle changes in the built environment, from the renewal of existing homes to the regeneration of entire neighborhoods. We expected major new housing to produce stronger visual signals from images. However, most of the change in housing happens through shifts in existing housing stock, especially in cities with rich histories, such as London. This type of change may show weaker visual signals in street-level images, potentially making monitoring more challenging. Tracking subtler changes, such as new coffee chains or repainting of facades, is critical as they may lead to undesired outcomes, including displacement caused by processes such as gentrification.
A visual investigation of image examples, such as those in Figure 4, revealed that our model can indeed distinguish between different levels of structural change in the built environment.

For example, the first image pair demonstrates that our model attributes close to zero change to pairs that show considerable visual differences in lighting conditions or seasonality. Minor structural alterations like the construction of fences, such as in the second image pair of the first row, lead to small but non-zero cosine distances. The second row shows examples of image pairs with slightly higher cosine distances, which begin to exhibit more substantial changes, such as a new paint job on the facade and the widening of the pavement. Newly constructed buildings are visible in the third row, while the fourth row has very high cosine distances that capture complete reconstructions of streets or neighborhoods. The fifth row shows examples of pairs with the highest distance values, where we found instances of extreme structural change and also many images that were rotated, corrupted, or anomalous in other ways. Capturing this variety of changes and anomalies was desired behavior when designing Street2Vec.
Change in Opportunity Areas
As part of the spatial development strategy published and periodically updated by the Mayor of London since 2004, Opportunity Areas (OAs) in Greater London are identified as key locations with the potential for new homes, jobs, and infrastructure. The Mayor and Local Authorities have actively incentivized new developments through various measures, including investments in transport links. Figure 5 illustrates the averaged changes for Middle Super Output Areas (MSOAs) and OAs.

We expected to see higher numbers of locations with greater change within OAs (i.e., higher values for the median and 75th percentile). In Figure 6, we compare distributions of point-level change for all OAs separately, along with the change in all other areas combined (“Non-OA” row). We found that OAs have significantly higher levels of median change and higher values for the 75th percentile compared to other areas in London. While we do not have ground truth data to validate point-level change detection, our results demonstrate the success of our model in highlighting neighborhoods where we would expect the largest change in London.

Our findings revealed substantial variation as captured by cosine distances, with specific areas experiencing substantial neighborhood change (e.g., Kings Cross and St. Pancras, Tottenham Court Road), along with areas lying on newly built transportation infrastructure such as the Northern Line extension or the Elizabeth Line (e.g., Battersea and Woolwich), as can be seen in Figure 5(b). Other areas showed limited change or are lagging in planning. This also provides essential information for the local governments as it highlights areas that have yet to experience the anticipated level of development despite incentives enabling targeted interventions, and also ones that have organically redeveloped without targeted policy interventions.
Visualizing neighborhood clusters
To further interpret the learned embeddings from Street2Vec, we visualized their spatial distribution using 10,000 randomly sampled street-level panoramas (taken at any point in time to get unbiased temporal and spatial coverage). We colored the embeddings based on their position in a Uniform Manifold Approximation and Projection (UMAP) [2] to two dimensions, as illustrated in Figure 7. Concretely, we assigned HSV colors to each point in the UMAP projection, where the hue corresponds to the angle between the axes, the value corresponds to the distance from the origin, and the saturation is kept at a maximum for each point. Similar colors in Figure 7 can be interpreted to represent similar neighborhoods according to our model.

Our coloring reveals interesting spatial patterns even though geographical coordinates were never explicitly given as a model input. In Figure 7(b), the city center is clustered together in different shades of green. Moving from the center towards the suburbs, light green colors gradually change to dark green, to red, and then to blue and magenta colors. The light blue points appear to follow London's motorways.
To provide an intuitive understanding of the information captured by UMAP’s two embedding dimensions, Figure 7(a) showcases sample images situated at the farthest extremes of the UMAP latent dimensions distribution. In the first (horizontal, x-axis) dimension, the three images with the lowest values come from residential areas with low-rise buildings (red points in the map), and the three images with the highest values are from roads and do not show any nearby settlements (light blue points in the map). Therefore, a possible interpretation for the first dimension of the UMAP could be “habitableness.” In the second (vertical, y-axis) dimension, images with the lowest values come from the urban core near the center (light green points in the map). In contrast, the ones with the highest values are scenes of suburbia with noticeable vegetation content (magenta points in the map). It seems likely that this dimension captures some form of “urbanization” in the images.
However, such visual interpretations are purely qualitative, and UMAP projections from a high-dimensional space down to two dimensions are difficult to interpret due to information loss. In contrast, the overall modes of variation in the embeddings learned by Street2Vec are likely to be much more complex.
For quantitative evaluations of our method for mapping urban change, we refer again to our preprint, available at https://arxiv.org/abs/2309.11354.
Conclusion
To our knowledge, this is the first application of self-supervised deep learning methods that demonstrate the successful use of temporal street-level images for measuring urban change. We have shown that street-level images can capture change in the built environment without needing manual labels. Our models can distinguish between changes resulting from major housing development projects and changes arising from the regeneration and renewal of existing houses.
Outlook and application of Street2Vec
Our approach can be readily applied to existing street-level image datasets, which are already available worldwide and undergo periodic updates by commercial providers. While researchers currently face access restrictions, the demonstrated success of our proposed method has the potential to capture the attention of data owners which could lead to cost-effective partnerships or integration into existing data pipelines and result in the creation of a comprehensive global dataset. Developing a tracking tool would facilitate the measurement of progress toward achieving universal access to adequate, safe, and affordable housing on a global scale. This tool would not only benefit local governments and countries but also contribute significantly to the attainment of SDGs.
Please reach out to us if you would like to know more or would like to apply Street2Vec to your use case. Moreover, the model weights and precomputed embeddings are available at https://gitlab.renkulab.io/deeplnafrica/Street2Vec/.
Co-authors
- Michele Volpi, Swiss Data Science Center, ETH Zürich
- Esra Suel, Centre for Advanced Spatial Analysis, University College London
- Stephen Law, Department of Geography, University College London
- Nicolas Büttner, NADEL - Center for Development and Cooperation, ETH Zürich
- Kenneth Harttgen, NADEL - Center for Development and Cooperation, ETH Zürich
References
- Jure Zbontar, Li Jing, Ishan Misra, Yann LeCun, and Stéphane Deny. Barlow twins: Self-supervised learning via redundancy reduction. In International Conference on Machine Learning, pages 12310–12320. PMLR, 2021.
- Leland McInnes, John Healy, Nathaniel Saul, and Lukas Grossberger. Umap: Uniform manifold approximation and projection. The Journal of Open Source Software, 3(29):861, 2018.
- Steven Stalder, Michele Volpi, Nicolas Büttner, Stephen Law, Kenneth Harttgen, and Esra Suel. Self-supervised learning unveils change in urban housing from street-level images. arXiv preprint arXiv:2309.11354.


