
ACE-DATA
Delivering Added-value To Antarctica

Abstract
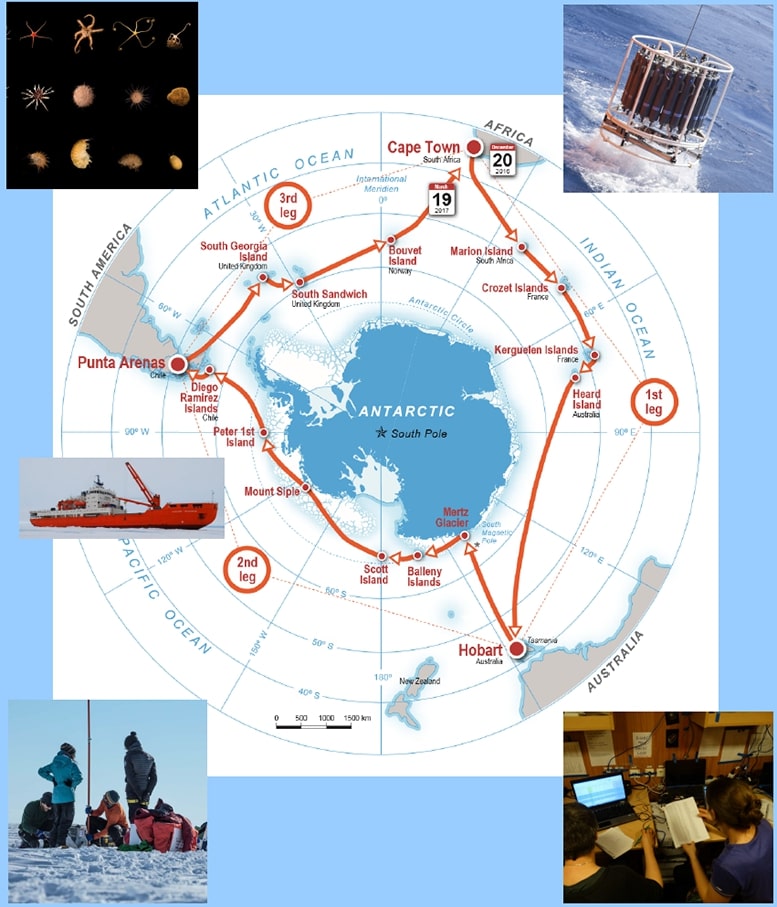
The Antarctic Circumnavigation Expedition (ACE) is a unique scientific expedition that took place from 20 December 2016 to 19 March 2017. Organised by the Swiss Polar Institute (SPI) and funded mostly through private philanthropy, ACE brought together more than 150 scientists from 23 countries collaborating on 22 projects on a research vessel that sailed all around Antarctica, conducting continuous measurements of physical, biological and chemical properties of the ocean and atmosphere, throughout the Southern Ocean and at 12 groups of islands for terrestrial sampling along the way.
ACE is unique and exceptional in many ways:
- It is ambitious scientifically, by aiming to close key gaps in knowledge of various disciplines by sampling in remote areas, some of which had never been sampled before, and connecting the in-situ data to the larger context of previous surveys, satellite observations and modeling studies.
- It was conceived as a multidisciplinary approach to a range of aspects of the Antarctic, the Southern Ocean and the sub Antarctic islands, creating the conditions for collaboration between all the different groups which was reflected in experimental co-design and joint sampling strategies.
- It enabled sampling during a single summer season all around the continent to provide new baselines for change and open up the possibilities of addressing major questions, such as the extent and significance of global change in this region, by sampling from land, sea and air at multiple stations.
- The voyage finally collected data from over 3600 events at 96 stations. With more than 27500 samples collected and still awaiting analysis there is a great deal of further data to add to the existing files for many of the projects. Moreover, several projects continuously recorded oceanographic and atmospheric variables with time resolutions of well below one hour, providing an unprecedented temporal and spatial coverage of the region.
- The 22 projects are each coordinated by a Principal Investigator (PI) with host institutions located all around the world making ACE a truly international project that connects Southern Ocean and Antarctic researchers at an international level. The SPI coordinates and funds the effort, and it also defined common principles for data and sample sharing. All PIs regularly report to the SPI on progress and must submit regular scientific and financial reports, the former includes a specific section about data management.
Although this region is key to many issues relating to climate change and climate regulation, such a comprehensive expedition linking the Southern Ocean and the Sub-Antarctic islands had never before been realized. And it had been more than 60 years since the last international scientific circumnavigation of Antarctica had taken place. First results and preliminary analysis of data during the voyage suggest that significant publications can be expected from many individual projects (e.g. on micro-plastics, carbon-sink, whale population recovery, evolution of island faunas, Southern Ocean meteorology and atmospheric chemistry).
The individual marine stations incorporate a wide range of measurements, both chemical and biological, and are already tied to measurements made on the continuous sea water flow linking each of the stations into a continuous assessment. The core navigation and weather station data provide a framework for many of the projects. Atmospheric measurements were also a combination of continuous monitoring by a variety of instruments complemented by specific stations at which, for example, radiosondes were launched for vertical profiles. Biological data was collected on land by sampling soils, invertebrates and vegetation, in the air by sampling for propagules both continuously from the ship and separately on each island.
Given that the data sets of these 22 projects have been managed in a common way and their metadata entered into a common system during the expedition, and given the extreme rarity of such extensive data sets, it is important to answer some of the more holistic questions by developing the interlinkages.
In order to valorise this unique set of data, the ACE-DATA project therefore aims at establishing a common platform as a tool for the 22 ACE projects to work on and from and enable collaborations as well as open access. Furthermore, data sciences offer an unprecedented opportunity to break down the walls of science silos and “make new science” beyond the original planned individual project results.
People
Collaborators

Eric received his PhD degree in Electrical Engineering from Columbia University, New York, in June 1999. Eric Bouillet has been working at IBM T.J. Watson Research Center, Hawthorne, NY since June 2004, and at the IBM Smarter City Technical Centre, Dublin from October 2010 to August 2016. While at IBM he has been working on scalable data stream analytics applied to a number of fields, including finances, law-enforcement, telecommunications, environmental monitoring, intelligent transport systems, and aircraft reliability control systems. Before joining IBM Research, Eric Bouillet was at Tellium, Oceanport, NJ where he was part of the research team who invented and designed the first commercial optical mesh restoration network (deployed nationwide and documented in their book Path Routing in Mesh Optical Networks), and at Lucent Technologies’ Mathematical Science Center in the department of Mathematics of Networks and System Research department where he worked on the design optimization and sizing of circuit and packet switched networks.

Michele received a Ph.D. in Environmental Sciences from the University of Lausanne (Switzerland) in 2013. He was then a visiting postdoc in the CALVIN group, Institute of Perception, Action and Behaviour of the School of Informatics at the University of Edinburgh, Scotland (2014-2016). He then joined the Multimodal Remote Sensing and the Geocomputation groups at the Geography department of the University of Zurich, Switzerland (2016-2017). His main research activities were at the interface of computer vision, machine and deep learning for the extraction of information from aerial photos, satellite optical images and geospatial data in general.
description
Problem:
A unique opportunity to collect data at the same time and location across wide-ranging scientific disciplines. But how to:
- Combine hugely varied but linked data sets in a meaningful and easy-to-use way?
- Break the silos of subject-specific data sets?
- Work in a cross-disciplinary manner on questions and still take advantage of these data sets?
Proposed approach:
- Integrated platform providing means for scientists to combine and investigate very different data sets, then open access to ACE data communinty
- Machine learning techniques/adv. statistical methods applied to oceanographic and atmospheric data sets to investigate interactions at the air-sea interface (ASAID)
Impact:
- Contribute to a holistic understanding of the Southern Ocean and impacts on climate regulation
- New insights into air-sea interaction in the Southern Ocean
- Open access to unique datasets
Presentation
Gallery

Annexe
Conference communications and workshops
- Jen Thomas, Marco Alba, Eric Bouillet, Antonio Novellino, Carles Pina Estany, Michele Volpi. (2021) How to stop re-inventing the wheel: a data management case study, International Conference on Marine Data and Information Systems, online. (keynote)
- Landwehr, S., Modini, R., Schmale, J., Volpi, M., Toffoli, A., Thurnherr, I., Aemisegger, F., Wernli, H.; (2019) Investigation of sea spray source functions with remote ocean aerosol size spectra measurements from the Antarctic Circumnavigation Experiment, SOLAS open science conference.
Additionnal resources
Bibliography
Publications
Related Pages
More projects

ML4FCC

CLIMIS4AVAL

SEMIRAMIS
4D-Brains
News
Latest news

The Promise of AI in Pharmaceutical Manufacturing
The Promise of AI in Pharmaceutical Manufacturing
Efficient and scalable graph generation through iterative local expansion
Efficient and scalable graph generation through iterative local expansion

RAvaFcast | Automating regional avalanche danger prediction in Switzerland
RAvaFcast | Automating regional avalanche danger prediction in Switzerland
Contact us
Let’s talk Data Science
Do you need our services or expertise?
Contact us for your next Data Science project!