
TAPEDA
Towards Automated Post-Earthquake Damage Assessment
Abstract
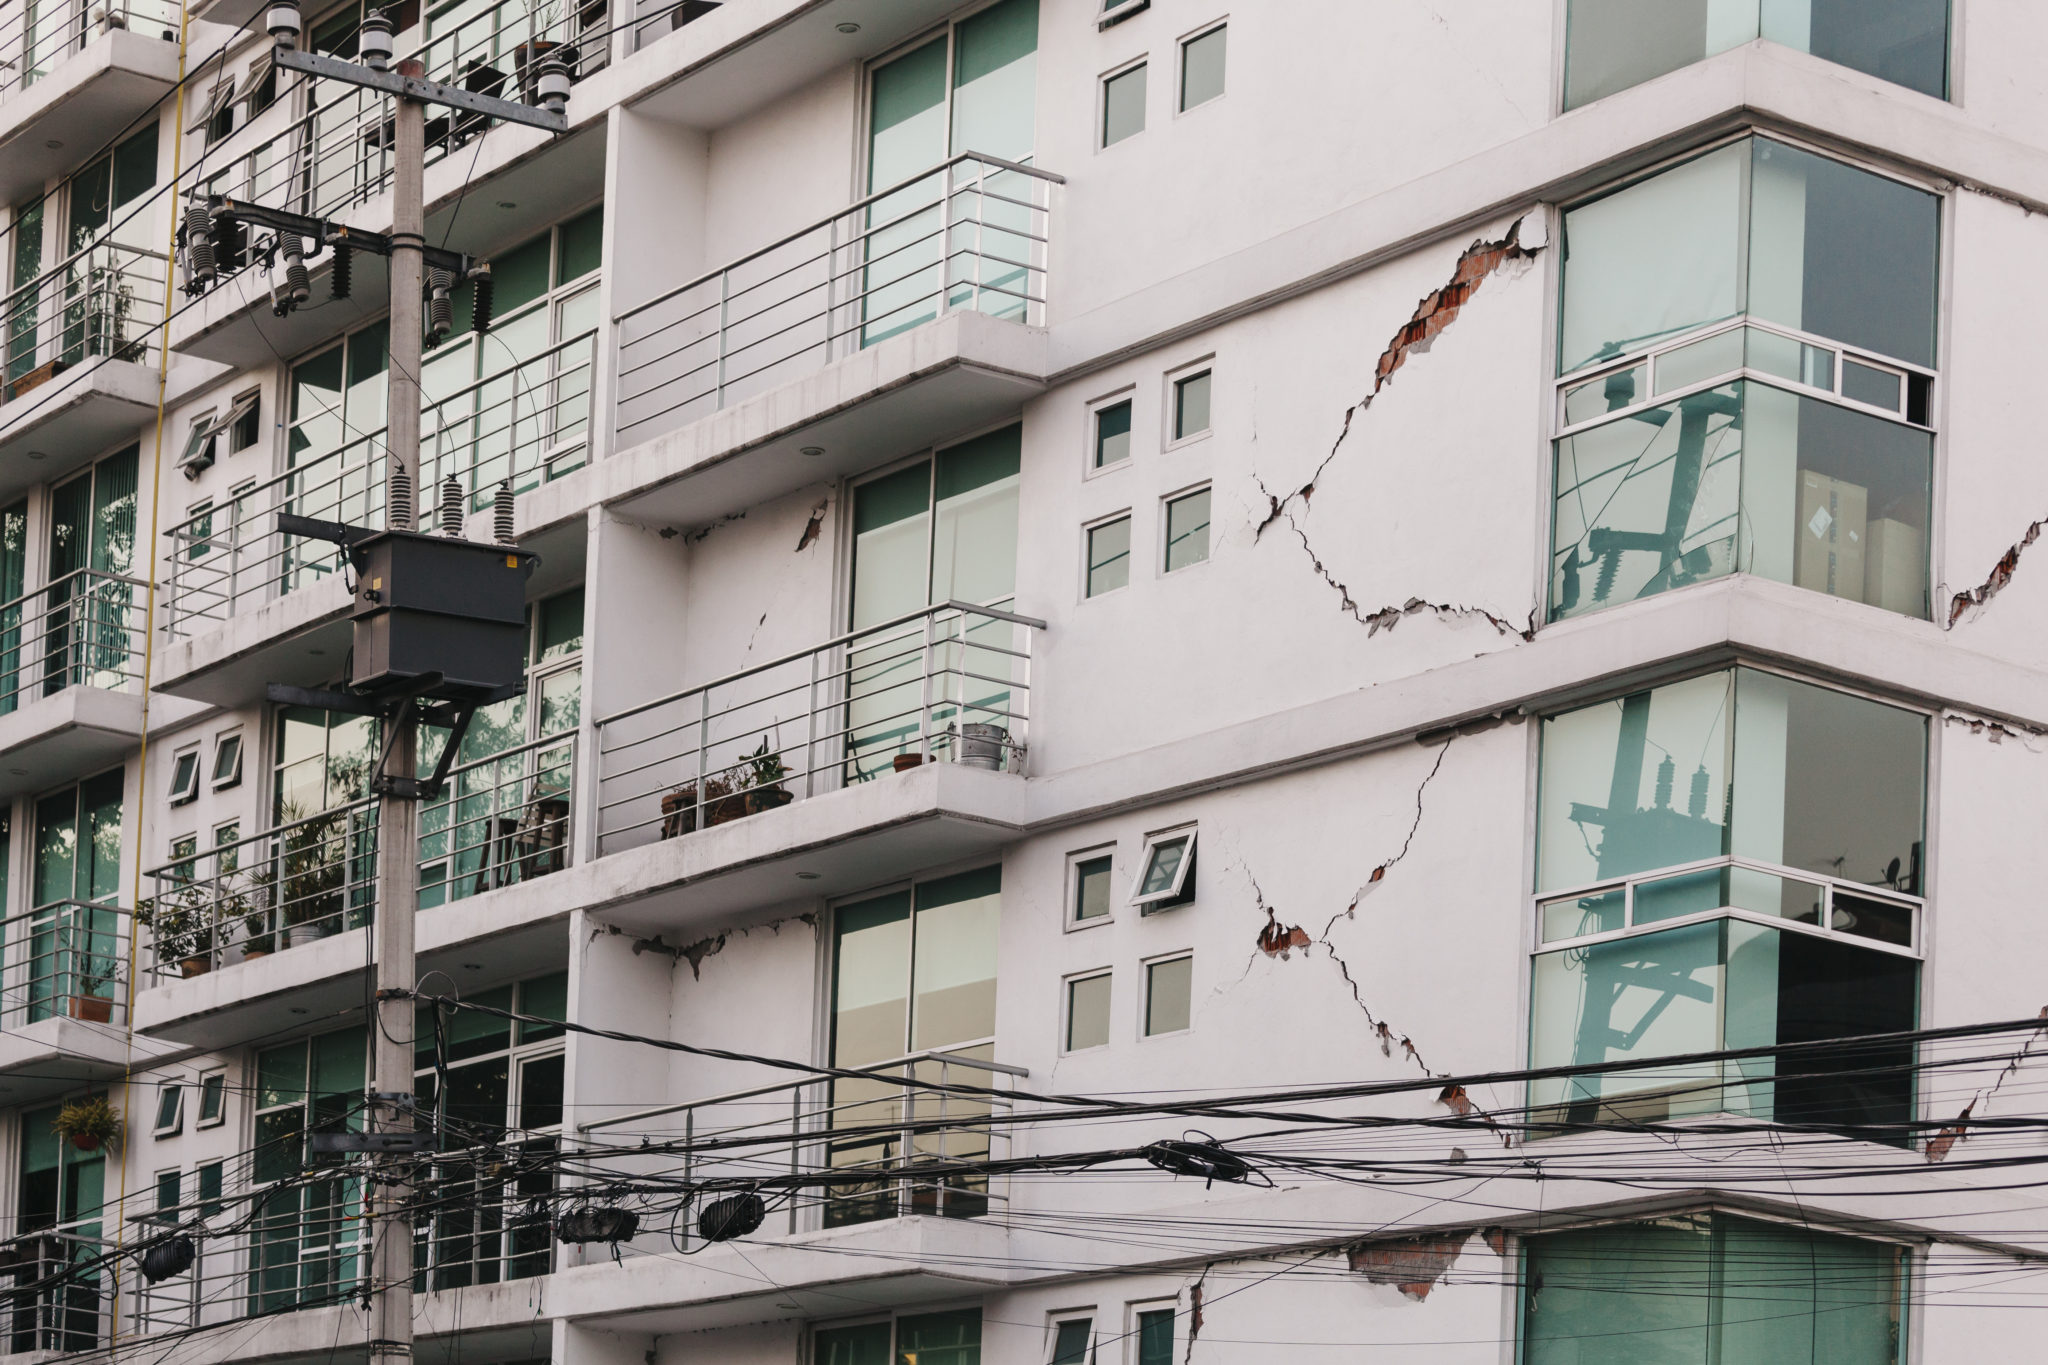
After earthquakes, engineers assess the damaged state of buildings through visual inspection and judge whether they are safe to enter or not. Damage evaluation is therefore at present a very labor-intensive task, which requires a visual inspection of all potentially affected buildings. After the magnitude M=6.3 earthquake in L’Aquila in 2009, for example, 8’000 experts assessed 72’000 buildings over a period of five months spending in average 0.5 working days per building. In addition to this, the evaluation of the damage is very subjective in nature and therefore error-prone. The TAPEDA project addresses stone masonry buildings, which are among the most vulnerable buildings during earthquakes. First, we need to obtain a 3D abstraction of the building from its point cloud obtained through Structure from Motion (SFM) techniques, which helps setting up a finite element model. Second, we need detect damage to a building from images using computer vision techniques and place them on the 3D model. The capacity loss assessment may now be performed automatically using computational models. Even with some manual intervention, such a computer-assissted approach is expected to reduce the time of capacity loss from days to hours, using far fewer engineers, and be more objective in nature.
People
Collaborators

Radhakrishna has a PhD in Computer Science from EPFL Switzerland, an MSc in Computer Science from NUS Singapore, and a BEng degree in Electrical Engineering from JEC India. During his 16 years of working experience, he has worked in the industry and academia, and has founded three start-ups. He has published over 20 refereed papers, which have received over 9000 citations. He is a co-inventor in 4 patents. He has served as a reviewer for several conferences and journals of repute and as area chair for ECCV 2016. His main interests are Computer Vision, Image Processing, and Machine Learning.
description
- The TAPEDA project is concerned with the automatic assessment of safety of buildings in the aftermath of an earthquake, which, done manually, is arduous, time-consuming, and expensive.
- To do this automatically, we need to take pictures of a building with a drone and obtain a wireframe model of the building. From this an equivalent Frame Model (EFM) can be obtained, which permits the computation of capacity loss of the building.
- There are two possibilities in sight to obtain a wireframe. One requires us to create the point cloud and then do meshing. The other approach may be to bypass the creation of the point cloud altogether by creating the wireframes directly from 2D pictures.
Approach
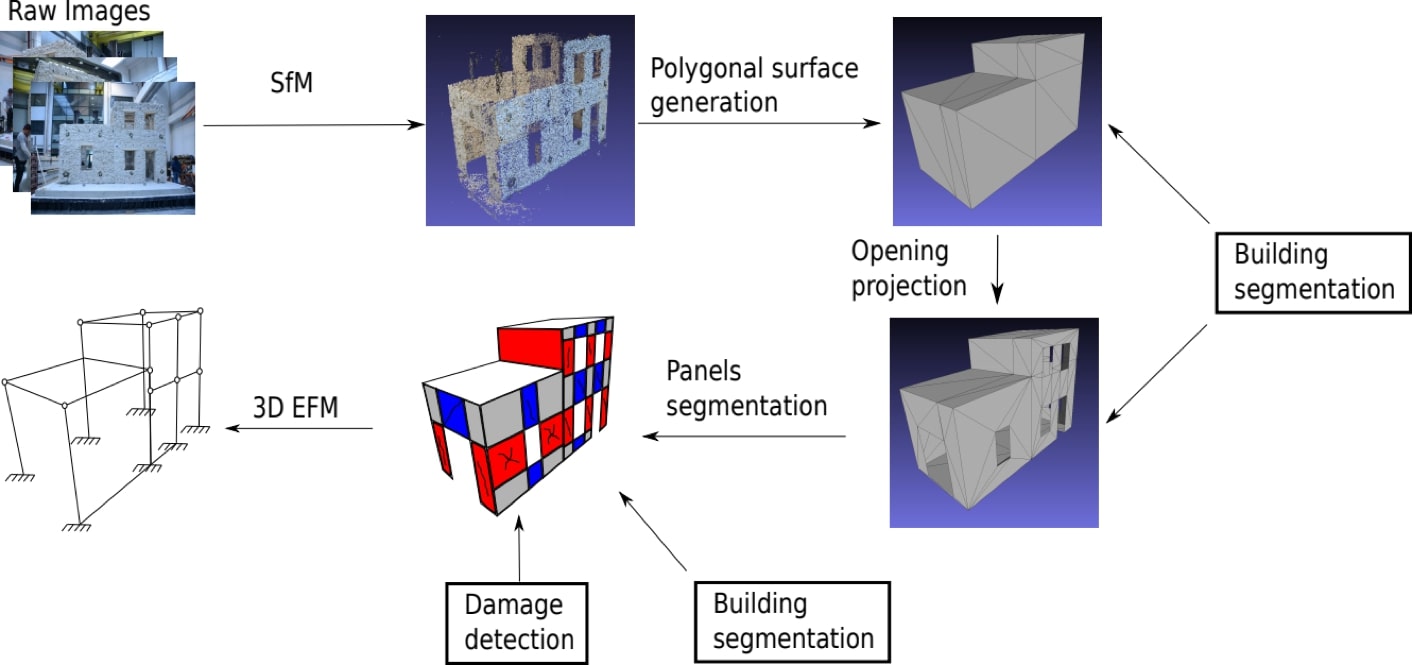
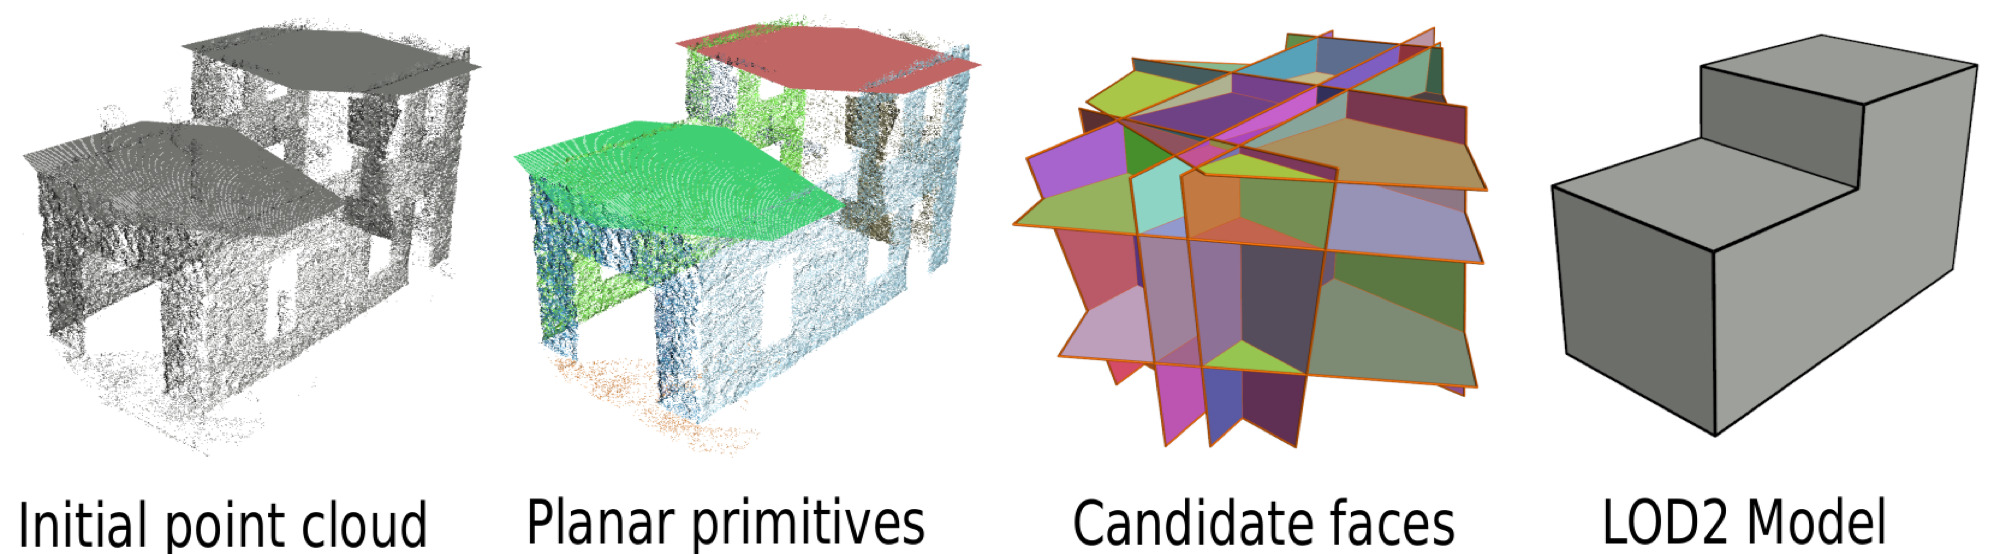
To assess safety of damaged buildings automatically, we need to take pictures of a building with a drone and obtain a wireframe abstraction of the building. We have a pipeline now which nearly gets us to the end goal but requires minor manual interventions (see figure below). This pipeline requires us to create a point cloud using Structure-from-Motion (SfM) techniques, which is reduced to a planar abstraction by fitting 3D planes to the point cloud. Alongside, damages, in particular cracks, as well as opening, namely, windows and doors are detected using deep networks and then projected on to the 3D model of the building.
Presentation
Gallery
Annexe
Additionnal resources
Bibliography
Publications
Related Pages
More projects

ML4FCC

CLIMIS4AVAL

SEMIRAMIS
4D-Brains
News
Latest news

The Promise of AI in Pharmaceutical Manufacturing
The Promise of AI in Pharmaceutical Manufacturing
Efficient and scalable graph generation through iterative local expansion
Efficient and scalable graph generation through iterative local expansion

RAvaFcast | Automating regional avalanche danger prediction in Switzerland
RAvaFcast | Automating regional avalanche danger prediction in Switzerland
Contact us
Let’s talk Data Science
Do you need our services or expertise?
Contact us for your next Data Science project!